Fatigue is the initiation and growth of a crack under repeated loading at stresses well below the yield strength. Machine components are rarely overloaded once; they are loaded and unloaded millions of times — which is why most in-service failures are fatigue failures. Fatigue is a surface and detail phenomenon: life is won or lost through design detail and surface quality far more than through material selection.
What this note covers
- Stress cycle: amplitude, mean stress, stress range and the R ratio
- The Wöhler (S–N) curve, Basquin relation and the endurance limit in steels
- High-cycle versus low-cycle fatigue
- Mean stress criteria: Goodman, Gerber, Soderberg and the Haigh diagram
- Notch effects: Kt, Kf and notch sensitivity
- From specimen to component: surface, size, loading, temperature and reliability factors
- Variable amplitude loading, rainflow counting and Miner's rule
- Life-extending practices; testing and reporting standards
Why a Static Calculation Is Not Enough
Machine parts rarely fail because a single load exceeded the yield strength. They fail because a stress far below yield was applied a few million times. Fatigue is a local, progressive and cumulative damage process: a crack starts at a surface stress concentration, grows a little on each cycle, and the part breaks when the remaining section can no longer carry the load.
Defining the Cycle
Every fatigue statement needs the same four quantities: the stress amplitude σa = (σmax − σmin)/2, the mean stress σm = (σmax + σmin)/2, the range Δσ = σmax − σmin, and the ratio R = σmin/σmax. Fully reversed loading is R = −1; zero-to-tension is R = 0. Quoting a fatigue strength without its R value is meaningless, because the same amplitude behaves very differently around a tensile mean.
The S–N Curve and the Fatigue Limit
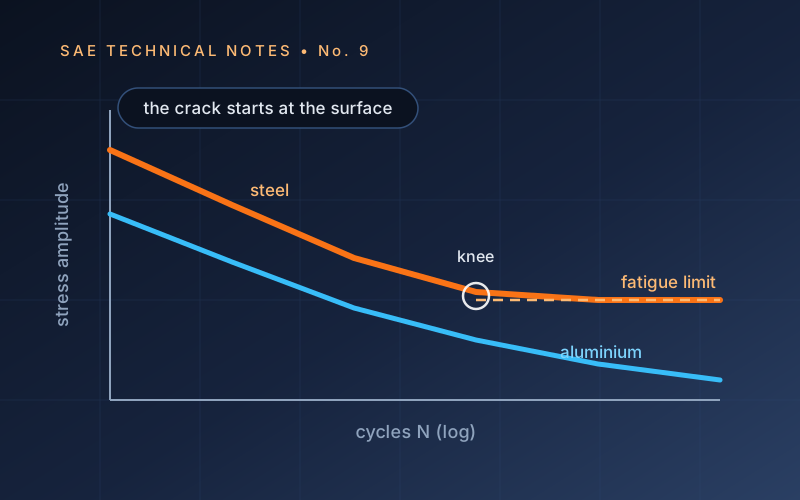
Plotted on log–log axes, the finite-life region follows Basquin’s relation σa = σ′f(2Nf)b. Ferritic steels show a knee near 106–107 cycles and a genuine fatigue limit, roughly 0.5 times the tensile strength for wrought steel. Aluminium, copper and austenitic stainless steels show no such plateau: the curve keeps descending, so a design is quoted at a stated life (for example 5×10⁸ cycles), never as “infinite”.
High-Cycle and Low-Cycle Fatigue
Above roughly 104–105 cycles the material stays elastic overall and a stress-life (S–N) approach is appropriate. Below that, local plastic strain dominates and the correct variable is strain: the Coffin–Manson relation governs, and ductility matters more than strength. Thermal cycling, start–stop loading of pressure equipment and crash-relevant structures fall into this regime, where a harder, stronger material can actually be the worse choice.
Mean Stress
A tensile mean stress opens the crack and shortens life; a compressive mean closes it and extends life. Three correction lines are in common use — Goodman (conservative, widely used for brittle and high-strength materials), Gerber (parabolic, closer to test data for ductile metals) and Soderberg (most conservative, protects against yielding as well). Plotted on a Haigh diagram, they turn a single fatigue strength into a usable envelope.
Notches, and the Cheapest Gain in Design
The elastic stress concentration factor Kt is a geometric fact; the fatigue notch factor is smaller because materials show notch sensitivity q:
Kf = 1 + q (Kt − 1)
High-strength steels are highly notch sensitive (q near 1); grey cast iron, full of internal graphite notches already, is almost insensitive. The practical consequence is blunt: the stronger the steel, the more a sharp corner costs. Increasing a fillet radius is usually the cheapest fatigue improvement available, and it is free if it is done on the drawing instead of after the failure.
From Specimen to Component: Correction Factors
| Factor | What it corrects | Practical effect |
|---|---|---|
| Surface | Roughness, as-forged or as-cast skin, decarburisation | The largest single loss — a rough forged surface can halve the fatigue strength |
| Size | Larger sections contain more defects and a larger stressed volume | Reduction of 10–25% for heavy sections |
| Loading | Bending, axial or torsional loading | Axial loading is more severe than rotating bending |
| Temperature and environment | Elevated temperature, corrosive media | In a corrosive environment the fatigue limit can disappear entirely |
| Reliability | Scatter in the data | Design values are percentiles, not averages |
Variable Amplitude Loading and Miner’s Rule
Real service loads are irregular. The sequence is first reduced to equivalent cycles by rainflow counting, and damage is then summed linearly: D = Σ(ni/Ni). Failure is nominally at D = 1, but linear summation ignores sequence effects, so design practice targets 0.2–0.5 depending on the industry.
Measures That Extend Fatigue Life
- Compressive residual stress: shot peening, deep rolling, induction hardening and nitriding all work by making the surface resist crack opening.
- Surface quality: polishing in the critical zone, removing decarburised layers, eliminating machining marks transverse to the stress.
- Geometry: generous radii, gradual section changes, relief grooves at shoulders.
- Cleanliness: inclusion control in the steel, since large non-metallic inclusions are internal crack starters in high-strength steels.
Testing and Reporting
Force-controlled fatigue testing follows ISO 1099 (axial) and ISO 1143 (rotating bending); strain-controlled low-cycle testing follows ISO 12106 / ASTM E606; statistical planning and evaluation of S–N data follow ISO 12107 and ASTM E739. Welded structures are assessed by fatigue class against EN 1993-1-9, where the detail category — not the parent material strength — sets the allowable range.
The technical note below (A4 PDF, in Turkish) develops these subjects in depth with original diagrams prepared for this series.